Augmented Reality (AR) is here. TV sports fans experience it as an imaginary line superimposed onto a football field indicating where the ball needs to advance to get a first down. Glass™ by Google is a small wearable computer in the form of conventional glasses with a transparent display that allows workers to view information hands- free. And while AR glasses have a see-through computer display for lenses, other forms of AR use conventional LED screens with a live camera feed. For instance, many recent land surveying instruments allow mapped points and lines to be superimposed over real time video feeds on data collectors for field staking or other surveying tasks. The benefits are obvious: an operator can see the real world with augmented visual data superimposed onto the display. Surveyors are already using augmented reality for quick access to digital data, but AR devices are evolving, opening up even more possibilities. Even new smartphones have stereo cameras and 3-D scanners built in to accommodate graphical rendering that appears to project images upon the surfaces in our surroundings. From Pokémon to monsters emerging from your living room wall, smart phones and dedicated AR devices support a variety of virtual or augmented reality games. AR apps are being made available to allow potential customers to see products superimposed into their living quarters or onto their bodies. These shopping enhancements will further drive AR technology into normal life.
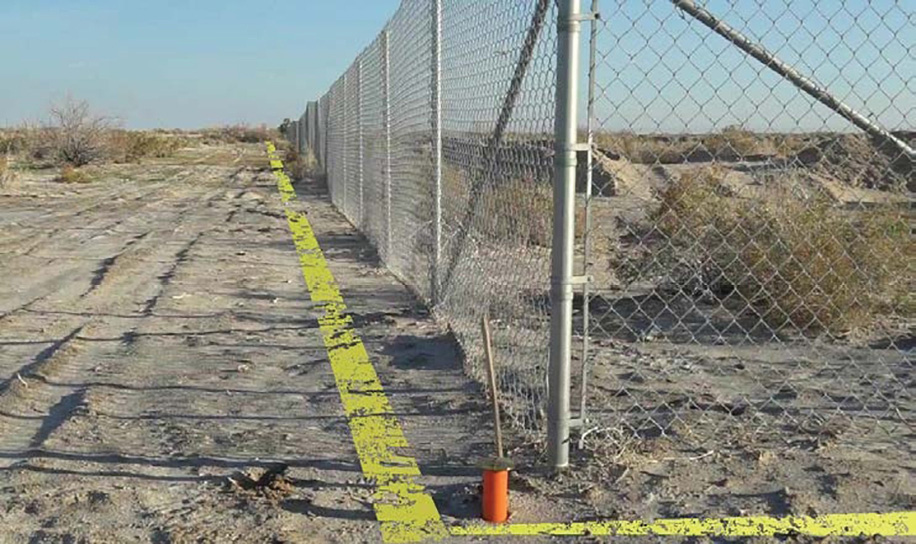
Figure 1: The yellow band is an example of how a boundary line may appear through Augmented Reality. An advanced display could extrude the boundary line upward and the AR boundary lines could move around to communicate their areas of uncertainty.
But what happens when parcel boundaries, published in digital map format by government agencies, appear as augmented reality, superimposed upon the physical world a lay person is witnessing? Figure 1 is a mockup of how that might appear. AR technologies already help surveyors in corner searching and could help hunters or other outdoors persons know when they pass to/from areas of differing regulations. Before looking at the great potential benefits AR offers for survey field operations and for lay users of parcel data such as hunters, campers, or appraisers, let us first examine some of the pitfalls.
If you jumped ahead of me, you are concerned that the Internet’s idea of a parcel corner’s location (coordinates) causes the corner to be superimposed over the ground in the “wrong” spot. Admittedly, the superimposed line will never be “exactly” where the boundary exists.1 There will always be some level of uncertainty in the measurements used to create the data as visualized. We see this using any GIS or CAD application to view existing parcel boundaries layered over aerial imagery. The closer we zoom in, the more evident it becomes that the parcel lines are not aligned with the fences and road centerlines seen in the image. Similarly, AR promises to let us see a survey monument superimposed on the surroundings at our feet, yet inherent in that scene will be some agency’s imperfect idea of where the property lines are. The mismatch between reality and digital will be more evident and potentially more misleading with AR than with previous GIS technologies.
Surveyors are the true Measurement Scientists. Imperfection and Uncertainty is our wheelhouse:
The true position of a legal point may never be measured exactly and a measured bearing and distance between two points is never perfect.2 But, once we can conceptualize and accept that exact distances, angles and coordinates can never be perfectly determined, we can focus on the real value that surveyors bring to the public: recognizing, evaluating and estimating the uncertainty of measurement values. This is not nitpicking! It is a perspective fundamental to our focus on the always-inexact nature of measurements between monuments. The conveyance of that information is critical in creating digitally published parcel locations.
Prior to my retirement from the Bureau of Land Management (BLM), I spent decades working with the Geographic Coordinate Database (GCDB). One of the most important concepts I learned is that digital parcel data is most trusted when derived from record survey measurements, properly analyzed by seasoned surveyors, integrating all data of various vintages, and thereby deriving the best estimates of positional values. Weighted least squares adjustments best predict coordinate values, as well as predicting the amount of uncertainty expected for each point.
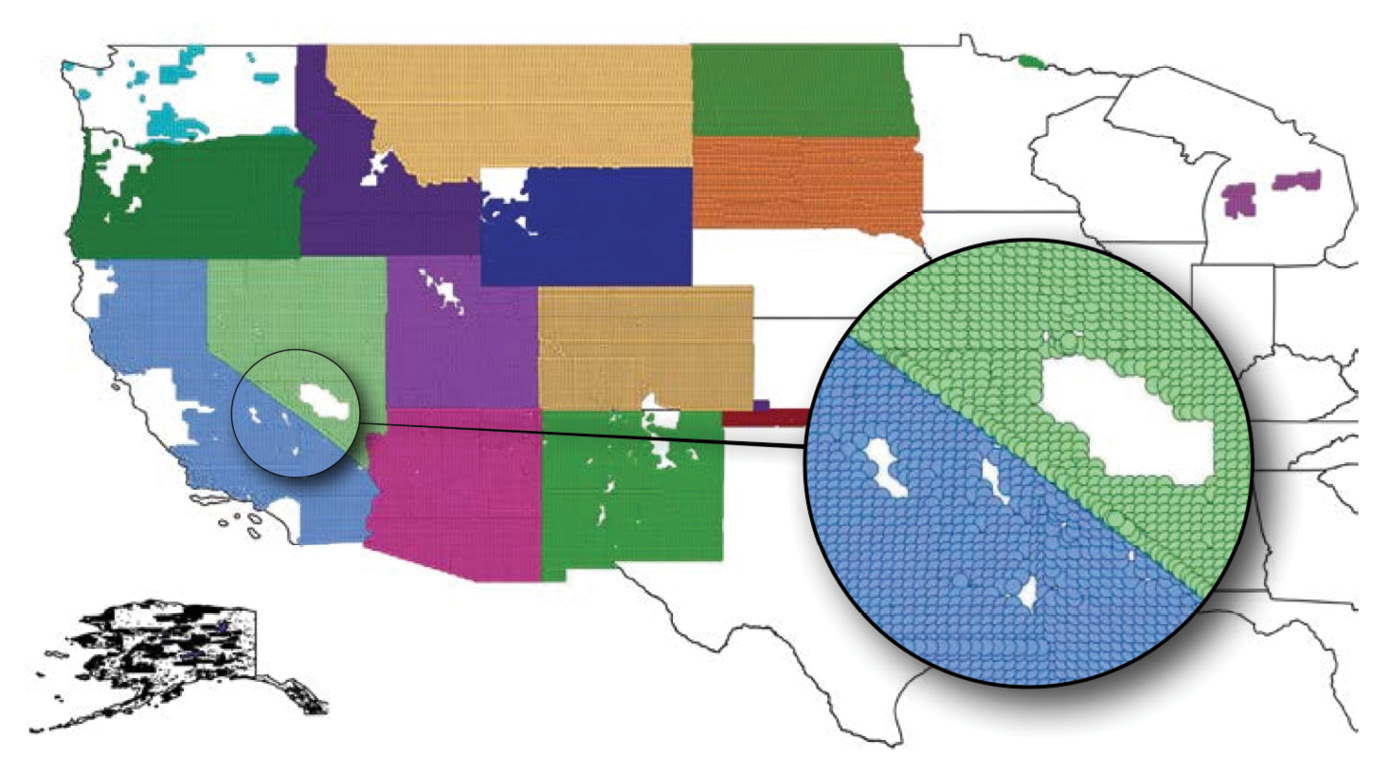
Figure 2: BLM’s GCDB coverage as of 2012-2017 (varies by state). Each dot represents a township. The data breaks down sections at least to the 40-acre parcel level. Private land holdings are not included in this particular data unless they were or are fully bounded by federal land.
The GCDB (see Figure 2) was created using this optimal approach. A simplified version of GCDB, boiled down for usage by the general public, has been formatted into an accepted national standard for parcel data. This standard is properly known as the Publication Standard of the Cadastral Theme of the Federal Geographic Data Committee (FGDC) National Data Spatial Infrastructure (NSDI), commonly referred to as the CadNSDI. This data can be streamed live at https://gis.blm.gov/arcgis/rest/services/Cadastral/BLM_Natl_PLSS_CadNSDI/MapServer. However, while these datasets were originally created through rigorous geometric analyses, this national standard does not include any source measurement data for surveyors to analyze or inspect. It has parcel polygons that are attributed with legal land descriptions and a bare minimum of attributes such as official acreage. The CadNSDI parcel standard requires points to contain values of positional uncertainty. In the future, surveyors will use parcel themes to navigate to an area of interest, then reveal and download the surveying related data underneath as well as the parcel data to which it is linked.
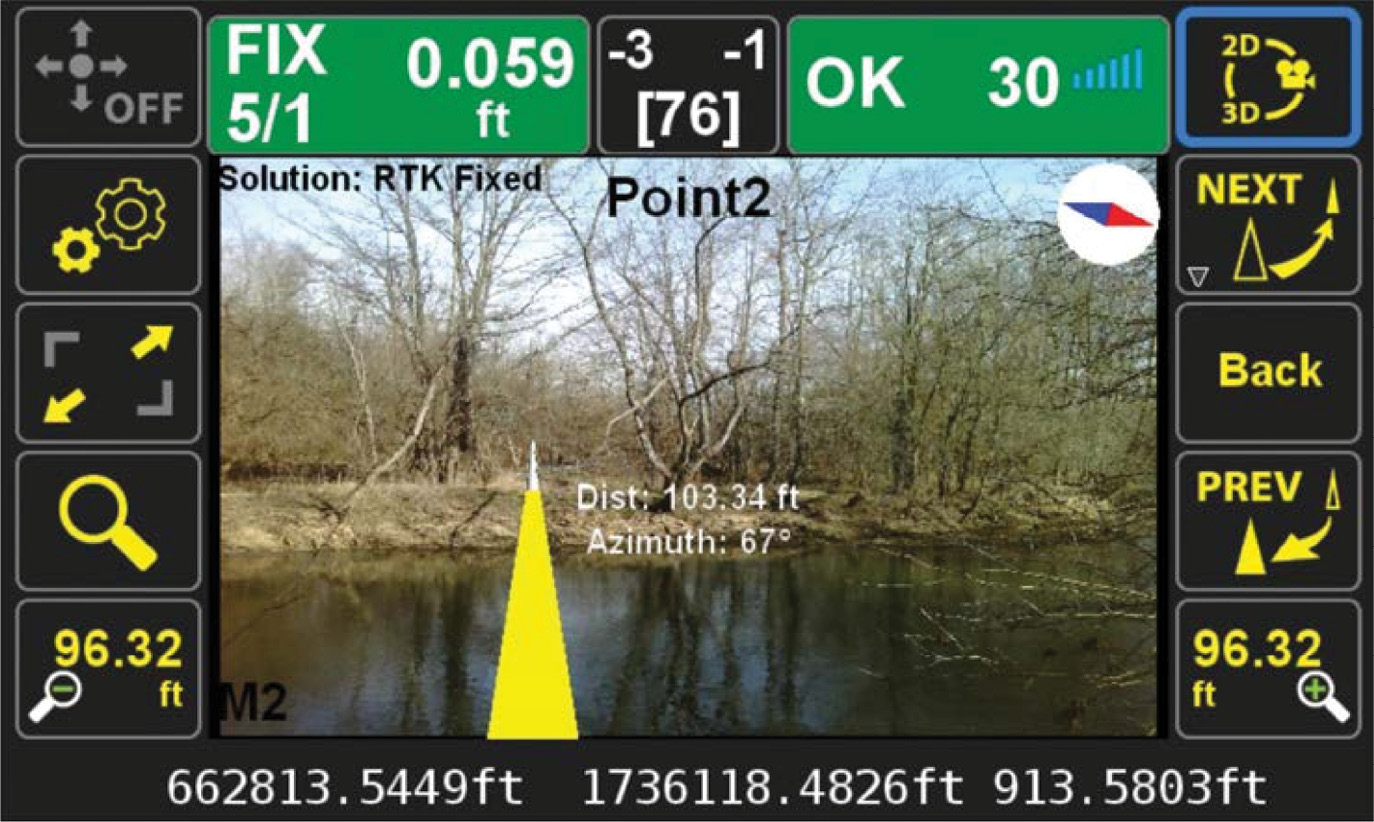
Figure 3: Example of AR displayed on the screen of a Javad Triumph LS GNSS receiver. Surveying instruments increasingly have the capability to overlay real time video feed with point staking information—a form of augmented reality.
Within the GCDB, the range of point uncertainty can be dramatic. In modern surveys the uncertainty may be less than an inch. However, for a few corner coordinate values in remote areas, the uncertainty is over a quarter of a mile. Large uncertainties are due to very imprecise measurements in the ancient-but-best-available survey plats and the lack of nearby control points. My point is that this variation in uncertainty must be clearly (and preferably graphically) communicated to the end user, especially if the end use is some form of augmented reality.
Transitioning to the advantages of AR, just imagine looking for a quarter section corner in a remote area. The GCDB or CadNSDI should already have best-guess coordinates for the corner monument and uncertainty indicators. Presently you can be guided to the search area by any GPS device, but in the near future this guidance will include a corner symbol projected onto the landscape within your AR display. In a corner recovery, surveyors would normally place a marker at the published coordinates and start searching, bearing in mind the x, y uncertainty attributes in GCDB for this point may be a large ellipse representing a 95% chance that the true corner point falls within that ellipse. With augmented reality however, the stake would already appear on your screen as a symbol and the uncertainty ellipse would be superimposed, at scale, upon the ground. Ideally, the AR software would also superimpose the connected boundary lines as a wide line, similarly scaled and tangent with the ellipse. A boundary line could be extruded up to appear as a wall that moves around through its uncertainty, as a straight or curvy wall. And, if survey plat images were indexed by geographic location it would be a simple matter to layer relevant plats on the AR display based on where you stand, as well as toggling the AR boundary line labels with the different published bearings and distances.
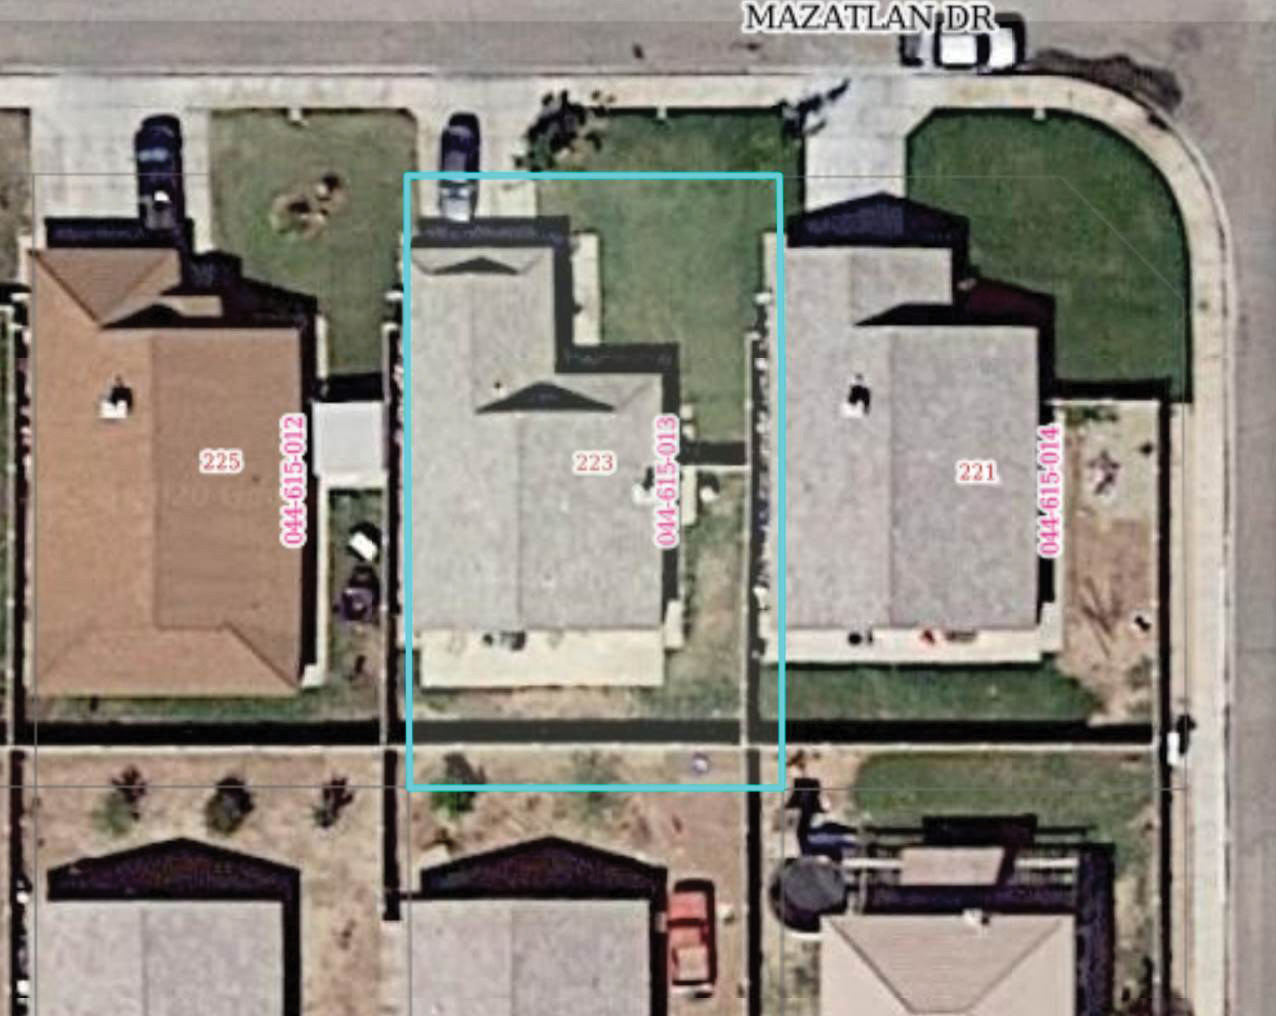
Figure 4: From this county appraisal website, it is obvious that the static property lines are not juxtaposed properly over the aerial imagery. Or maybe the property lines do run through people’s roofs. Who is to know without seeing the positional unreliability?
Returning to the use by a lay person, consider the difficulty of hunters wandering in the woods. The AR glasses could make good use of uncertainty indicators. The jurisdictional lines defining the different hunting zones could be projected onto the ground. A clearly shaded dividing line, perhaps ninety-feet-wide at one corner of a plot and tapering down to seventy-feet-wide at the other endpoint, would graphically represent an area of uncertainty. A pop-up information window would inform the user that AR boundary lines have uncertainty and therefore to rely on physical fencing and posting in that zone. Once inside a jurisdictional area, such as a non-wilderness US Forest Service, a pop-up display could also display other geo-attributes such as the designation for that area along with a list of the rules which the hunter or visitor must obey. The same functionality would be useful for law enforcement personnel. Similarly, real estate agents or property appraisers could better understand and communicate the extent of land for sale and avoid mistakenly placing too much confidence in digital data.
As Augmented Reality software makes it increasingly easy to access the parcel geometry theme of a city or county, any landowner can potentially see and be misled by land boundaries projected onto the ground as a line or a wall on their smartphone’s AR display or AR glasses. There MUST be a way to communicate the inexactness of these displays whether it is boundary lines with a width of the uncertainty or with some other method. Perhaps in this situation, a pop-up display with a message like: “CAUTION: DATA UNCERTAINTY MAKES LOCATION IN THIS AREA UNRELIABLE!” Otherwise, confusion will reign as a landowner fails to see or misunderstands the boundary line going down their property fence or wall. Based on the uncertainty we know exists in most GIS data, such visualization may mistakenly go through a house or indicate a violation of setback rules. It is a disservice to publish digital parcel lines and points as static, exact features. As surveyors, we know misinterpretation is foreseeable but preventable. We should actively promote solutions, not passively wait to say, “told you so.”
Figure 5: An early attempt to describe the uncertainty of coordinate location. The property line is expected to be within the purple shaded area 95% of the time. This is real data.
Digital parcel boundaries created without the rigorous network data analysis lack realistic indications of positional uncertainty and so it is hard to defend the practice as presently served up on many GIS and government websites. See Figure 4 for a real-life example of assessor data overlaid on aerial photography. Note, some aerial mapping providers do attempt to provide uncertainty indices in their data measurement tools. But reliability is unknown because many vendors of imagery products do not publish accuracy statements or employ a professional surveyor who, in some states like California, is the only qualified professional allowed to georeference published parcel data. Most agencies of course defend their practice by disclaimers and assert their data is good enough for their purposes. As we all know, any measurement may be good enough for something, but for what? Zoning decisions? Appraisals? Road maps? Unfortunately, other decisions should not be made with a large amount of latent positional uncertainty.
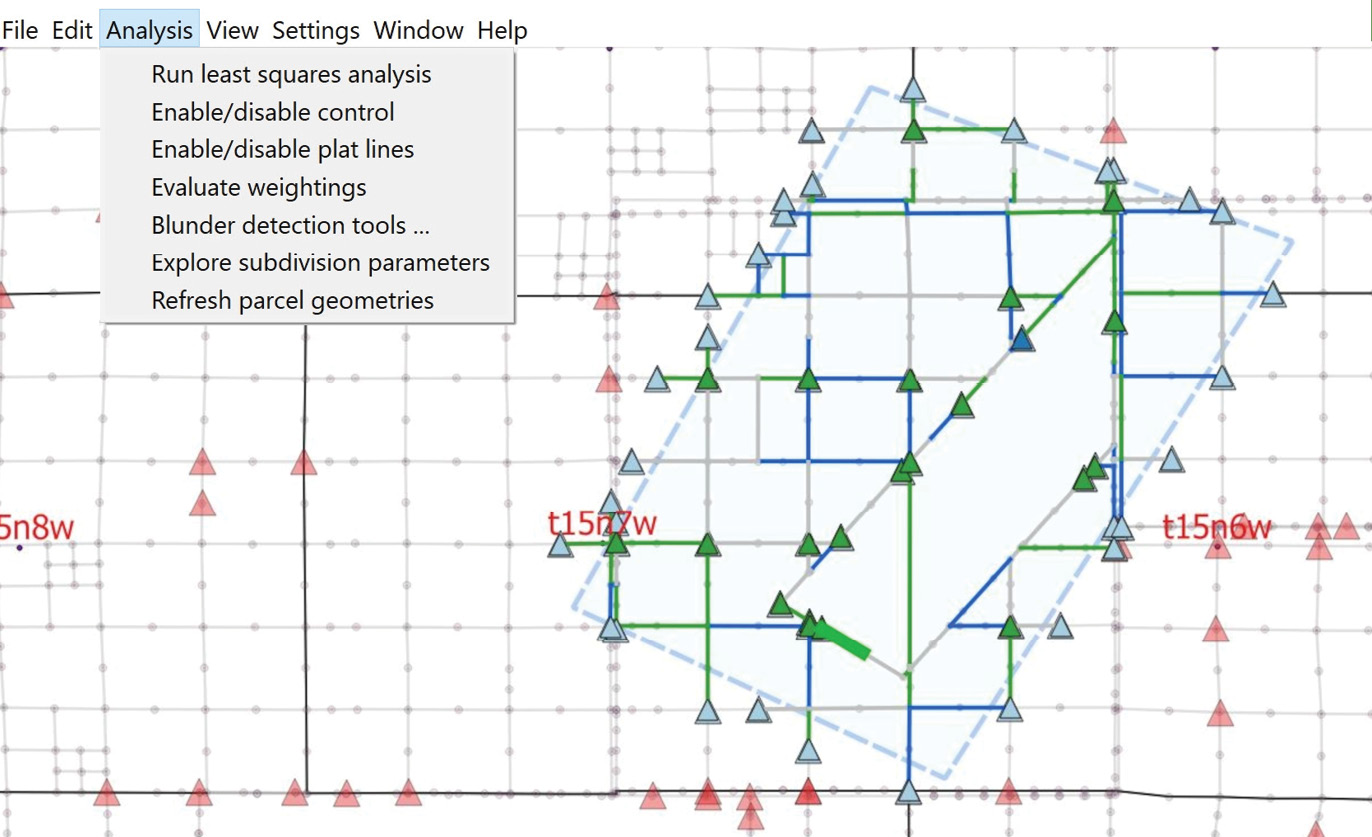
Figure 6: Mock up of survey software where the job being analyzed/adjusted is within the shaded blue area.
Might the same misleading parcel geometry data foster decisions in property disputes erroneously arising from inaccurate displays? How useful is the superimposed information to supporting facility management such as underground utility improvements that improperly appear to be correlated to parcel corners? When the uncertainty of parcel boundaries is not visualized, how does a user know if it is sufficient to support certain decisions? And if uncertainty is quantified, what is the most effective path to improving the trustability of the data?
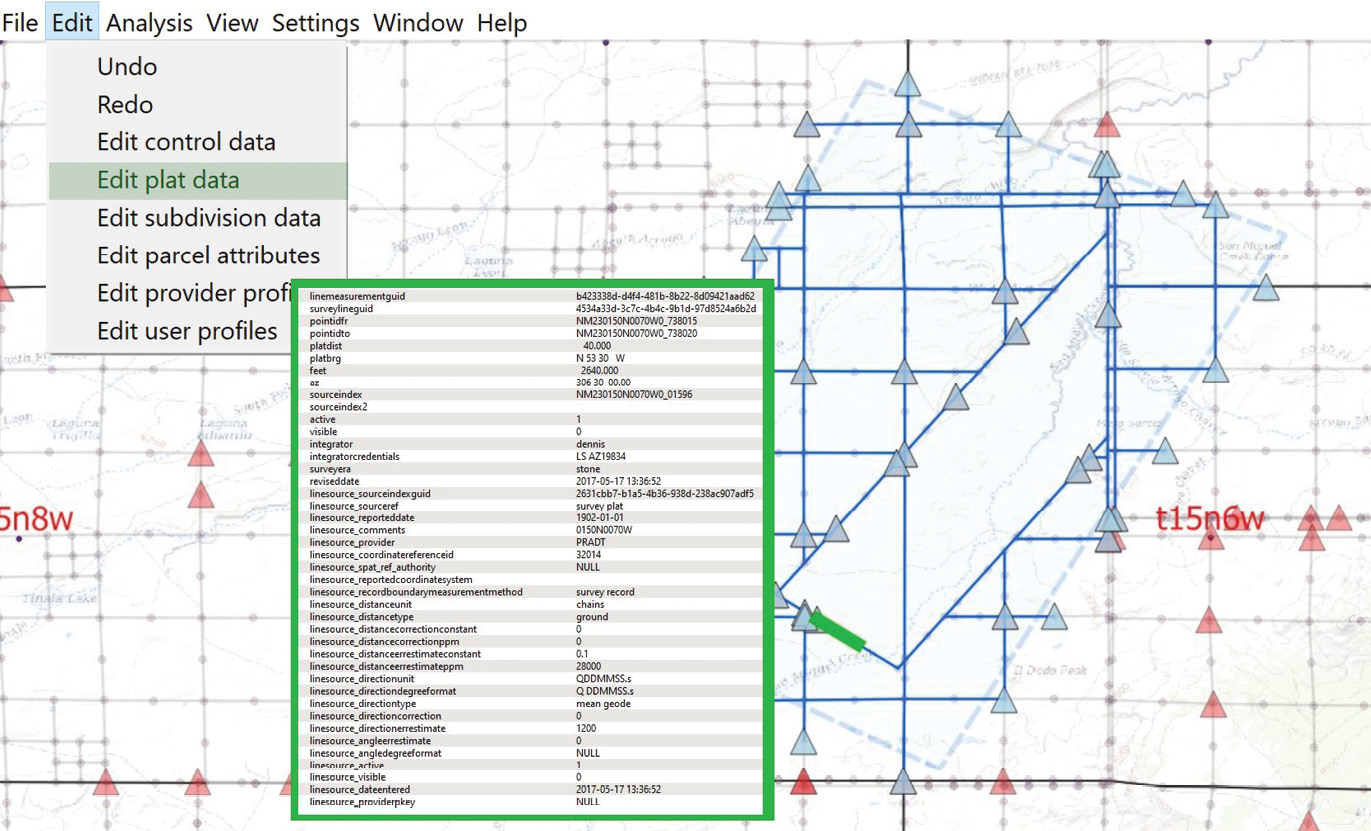
Mock up of software showing a database record of data in BLM’s GCDB. The data is available in text files. The author has migrated the measurement data into geodatabase tables.
Hint: data hidden deep inside a nearly incomprehensible attribute table is not the solution. As professionals, we could throw up our arms and declare the situation a mess. On the other hand, we could also consider the situation an opportunity and communicate persuasively to resolve these upcoming difficulties.
Constructing parcels from surveyed lines. Asterisks are intersections/proportion points, red lines are removed (non-parcel), blue lines are added by instruction, green lines are created through normal rules and by instructions to intersect or proportion.
For surveyors to assert themselves into the maintenance of digital parcel boundaries will, for some, be an introduction to new concepts. For example:
- The uncertainty of a parcel corner coordinates after adjustment or the estimated uncertainty of a control point or line dimensions must be published in such a way that others can easily access the information. This means using an open data concept and having a standardized, consistent data format.
- National data standards should be adopted for survey plat line measurements. A parcel line may have sevearal measurement values. All should be available and be properly weighted in correspondence with their relative accuracy.3 I proposed such a standard in the May 2018 issue of Surveying and Land Information Science.
- National standards should be adopted for parcel corner point control measurement data. An example of this is the Multistate Control Point Database in use by the states of Idaho and Montana4.
- Geometric network analysis is essential in properly weighting survey measurements to arrive at the most likely coordinate values as well as a defensible indication of positional uncertainty. The key technology is a full parametric least squares analysis/ adjustment. Statistical uncertainty information provided by surveyors is an extremely useful service for public usage only if and when presented in an understandable visualization.
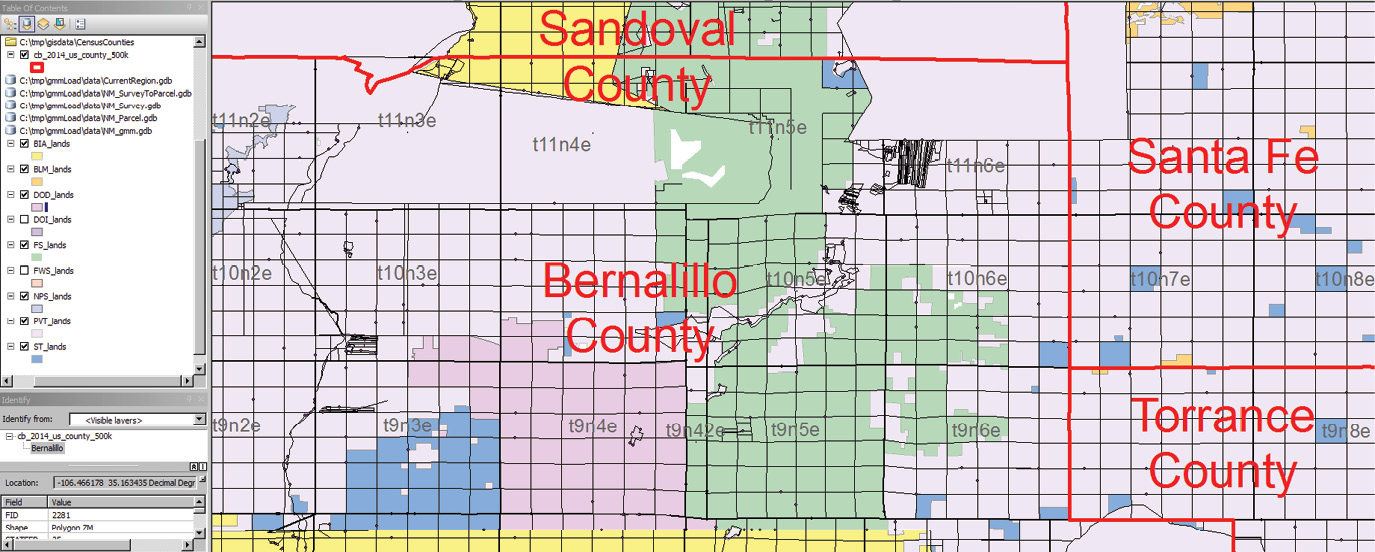
Each color represents a different data steward and counties are also data stewards. Maintaining edgematching along data steward boundaries will require collaboration and the sharing of data.
Augmented Reality survey technology exists and will improve immensely. Surveyors have a peek at this technology in their present instruments. It is only a matter of time until consumer grade devices can access mapping data such as soil type, vegetation type, historic topo maps and parcel boundaries. When these parcel boundaries are projected to true scale through smartphone screens or AR glasses they will not be projected onto their exact locations. Without some visualization of positional uncertainty, these AR boundaries will cause misinterpretations and confusion. The advantages of using AR glasses for survey fieldwork will also continue to grow. For all these reasons, it is prudent for surveyors to anticipate these AR problems and benefits. A committee of leading professional surveyors should develop a narrative to best frame the problem to the public as well as formulate an approach to organizing current and future digital data. Surveyors can seize the opportunity to create and maintain properly published parcel geometries which include positional uncertainties and to work with software engineers to effectively render visualizations of these uncertainties through augmented and virtual reality platforms.
For more detailed free information, download my ebook “The Digital Boundary Surveyor” in pdf format, https://1drv.ms/b/s!As8t4TFOF8xrsB4OZa049LcZfLhW?e=1DQVOA, or search “surveyorthink” on YouTube.com for my series of 10 short videos. The ebook appendices include the physical design of my proposed national surveying data standards. The 10th video explains the purpose of the standards.
Endnotes:
1 For more on this, see this video where I explain that boundary points (dimensionless) and boundary lines (no width) are invisible abstractions: https://youtu.be/pHdsieQtucI
2 In this video I explain the fallacy of exact measurements: https://youtu.be/lOtNiGBKIc8
3 Concepts of my proposed standard in the May 2018 issue of Surveying and Land Information Science. See also my webpages at http://edac.unm.edu/projects/surveypage for the 2017 version of my physical design.
4 See link to example ESRI-based viewer at: https://www.arcgis.com/home/webmap/viewer.html?url=https%3A%2F%2Fgiscenter.rdc.isu.edu%2Fserver%2Frest%2Fservices%2FHosted%2FMCPD_Points%2FFeatureServer%2F16&source=sd
Dennis McKay is a retired land surveyor with three decades with the Bureau of Land Management in Arizona and New Mexico, most of the time closely involved in developing and improving the Geographic Coordinate DataBase and being the BLM-wide Cadastral Survey Automation Coordinator. He and his wife spend winters in the southern California desert and enjoy the remaining time camping in and photographing beautiful places. Dennis welcomes comments at denniskmckay@yahoo.com