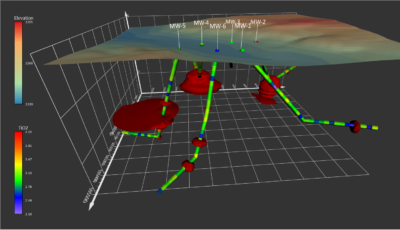
Display hole data using the new drillhole map type, manage the data in the Drillhole Manager, and view the data in true 3D.
Golden, Colorado, 14 September 2021 – Golden Software, a developer of affordable 2D and 3D scientific modeling packages, has introduced a powerful new drillhole mapping tool that allows users to visualize in 3D the location and subsurface route of underground wells. The drillhole feature is one of several new capabilities in the latest release of Surfer® that enhances the user’s ability to model, display and analyze subsurface data.
“The new drillhole functionality will be cheered by geologists, hydrologists, environmental scientists, and other Surfer users who need to analyze subsurface data associated with any type of well, borehole or drillhole,” said Kari Dickenson, Surfer Product Manager.
The Surfer package is used by more than 100,000 people worldwide, many involved in oil & gas exploration, environmental consulting, mining, engineering, and geospatial projects. Known for its fast and powerful contouring algorithms that regularly outperform more expensive packages, Surfer enables users to model data sets, apply an array of advanced analytics tools, and graphically communicate the results in ways anyone can understand. The software has been applied for more than 30 years by users in numerous disciplines to easily visualize and interpret complex data sets.
Golden Software has made the following enhancements in the latest Surfer version released today:
2D/3D Drillholes – Surfer easily imports drillhole data to generate a 2D drillhole layer that shows the location, deviation, and path of each hole, core, or well in plan view. The same data set can be used to generate a 3D view of the drillhole’s underground route – orientation, azimuth, inclination – with annotations for associated point and interval content data. Surfer imports collar information related to each drillhole, allowing the user to access drilling details (well type, driller, field, date, depth, etc.) and hole content (contaminant concentration, mineral concentration, assay results, geophysical properties, etc.) Drillhole paths, data points and intervals can be displayed and colorized by data values, and numerous well types can be represented with unique surface symbols.
Alpha Shape Boundary Creation – Users can now create a tight polygon boundary around data points in post, classed post and base layers or directly from any data file, even in concave areas. Control how tight the polygon is shrink-wrapped to the data limits. Use the polygon boundary for assigning NoData or delineating coverage area. Once a time-consuming manual task, this feature will be used extensively by geophysicists, geologists, and hydrologists who want to visualize and display only the areas where they have data.
Easy Isopach Calculation – Surfer accurately measures the true stratigraphic thickness of a unit or layer regardless of its orientation. This is especially useful in measuring underground geologic horizons that have been tilted at an angle away from horizontal. It can also be used to measure thicknesses of tailings piles above ground, sedimentary overburden, or reservoirs.
Fast Grid Math and Grid Volume Calculations – These standard Surfer functions have been improved so that calculations can easily be made between grid files of different geometries. Grid Math enables users to perform mathematical calculations, such as addition or subtraction, with one or more files, while Grid Volume determines the volume between an upper and lower grid surface. These calculations were always possible in Surfer but only between grid files with the exact same geometry – a rarity in real world applications.
Surfer Beta Available
As is the tradition, Golden Software has released a Beta version of Surfer simultaneously with the new version to give customers a chance to try out new features while they are still in development. Users may find the Beta version by clicking File | Online from within Surfer.
“In our newest Beta features, we are continuing to improve ease-of-use and the overall Surfer user experience,” said Dickenson.
Here are the new features available in Beta now, to be officially included in the Winter 2022 release of Surfer:
- Scale Bars and Color Bars can now be put in frames with background colors to make them more visible and easier to read when placed on top of maps.
- Grid files can be saved as GeoTIFFs, or Tagged Image File Format, which allows for easy data compatibility with other software packages.
- 3D points can be digitized in 3D View with a single click to capture the X, Y and Z coordinates.
- 3D Surface Map in 2D Plot Window allows the user to fill the sides of the 3D surface layers down to a customized Z value. This is especially useful when overlaying surface maps to create a block model, so the side fill is continuous to the user-selected base level instead of the grid minimum.
About Golden Software
Founded in 1983, Golden Software is a leading developer of affordable scientific graphics software. Its customer base includes over 100,000 users involved in environmental consulting, oil and gas exploration and extraction, mining exploration and extraction, engineering, applied science, business, education, and government in nearly 190 countries and territories. Golden Software offers four products: Surfer® for gridding, contouring and 3D surface mapping; Grapher™ for 2D and 3D graphing; Voxler® for 3D data visualization; and Strater® for well log, borehole and cross section plotting. For additional information, visit www.GoldenSoftware.com or call 1-303-279-1021.
