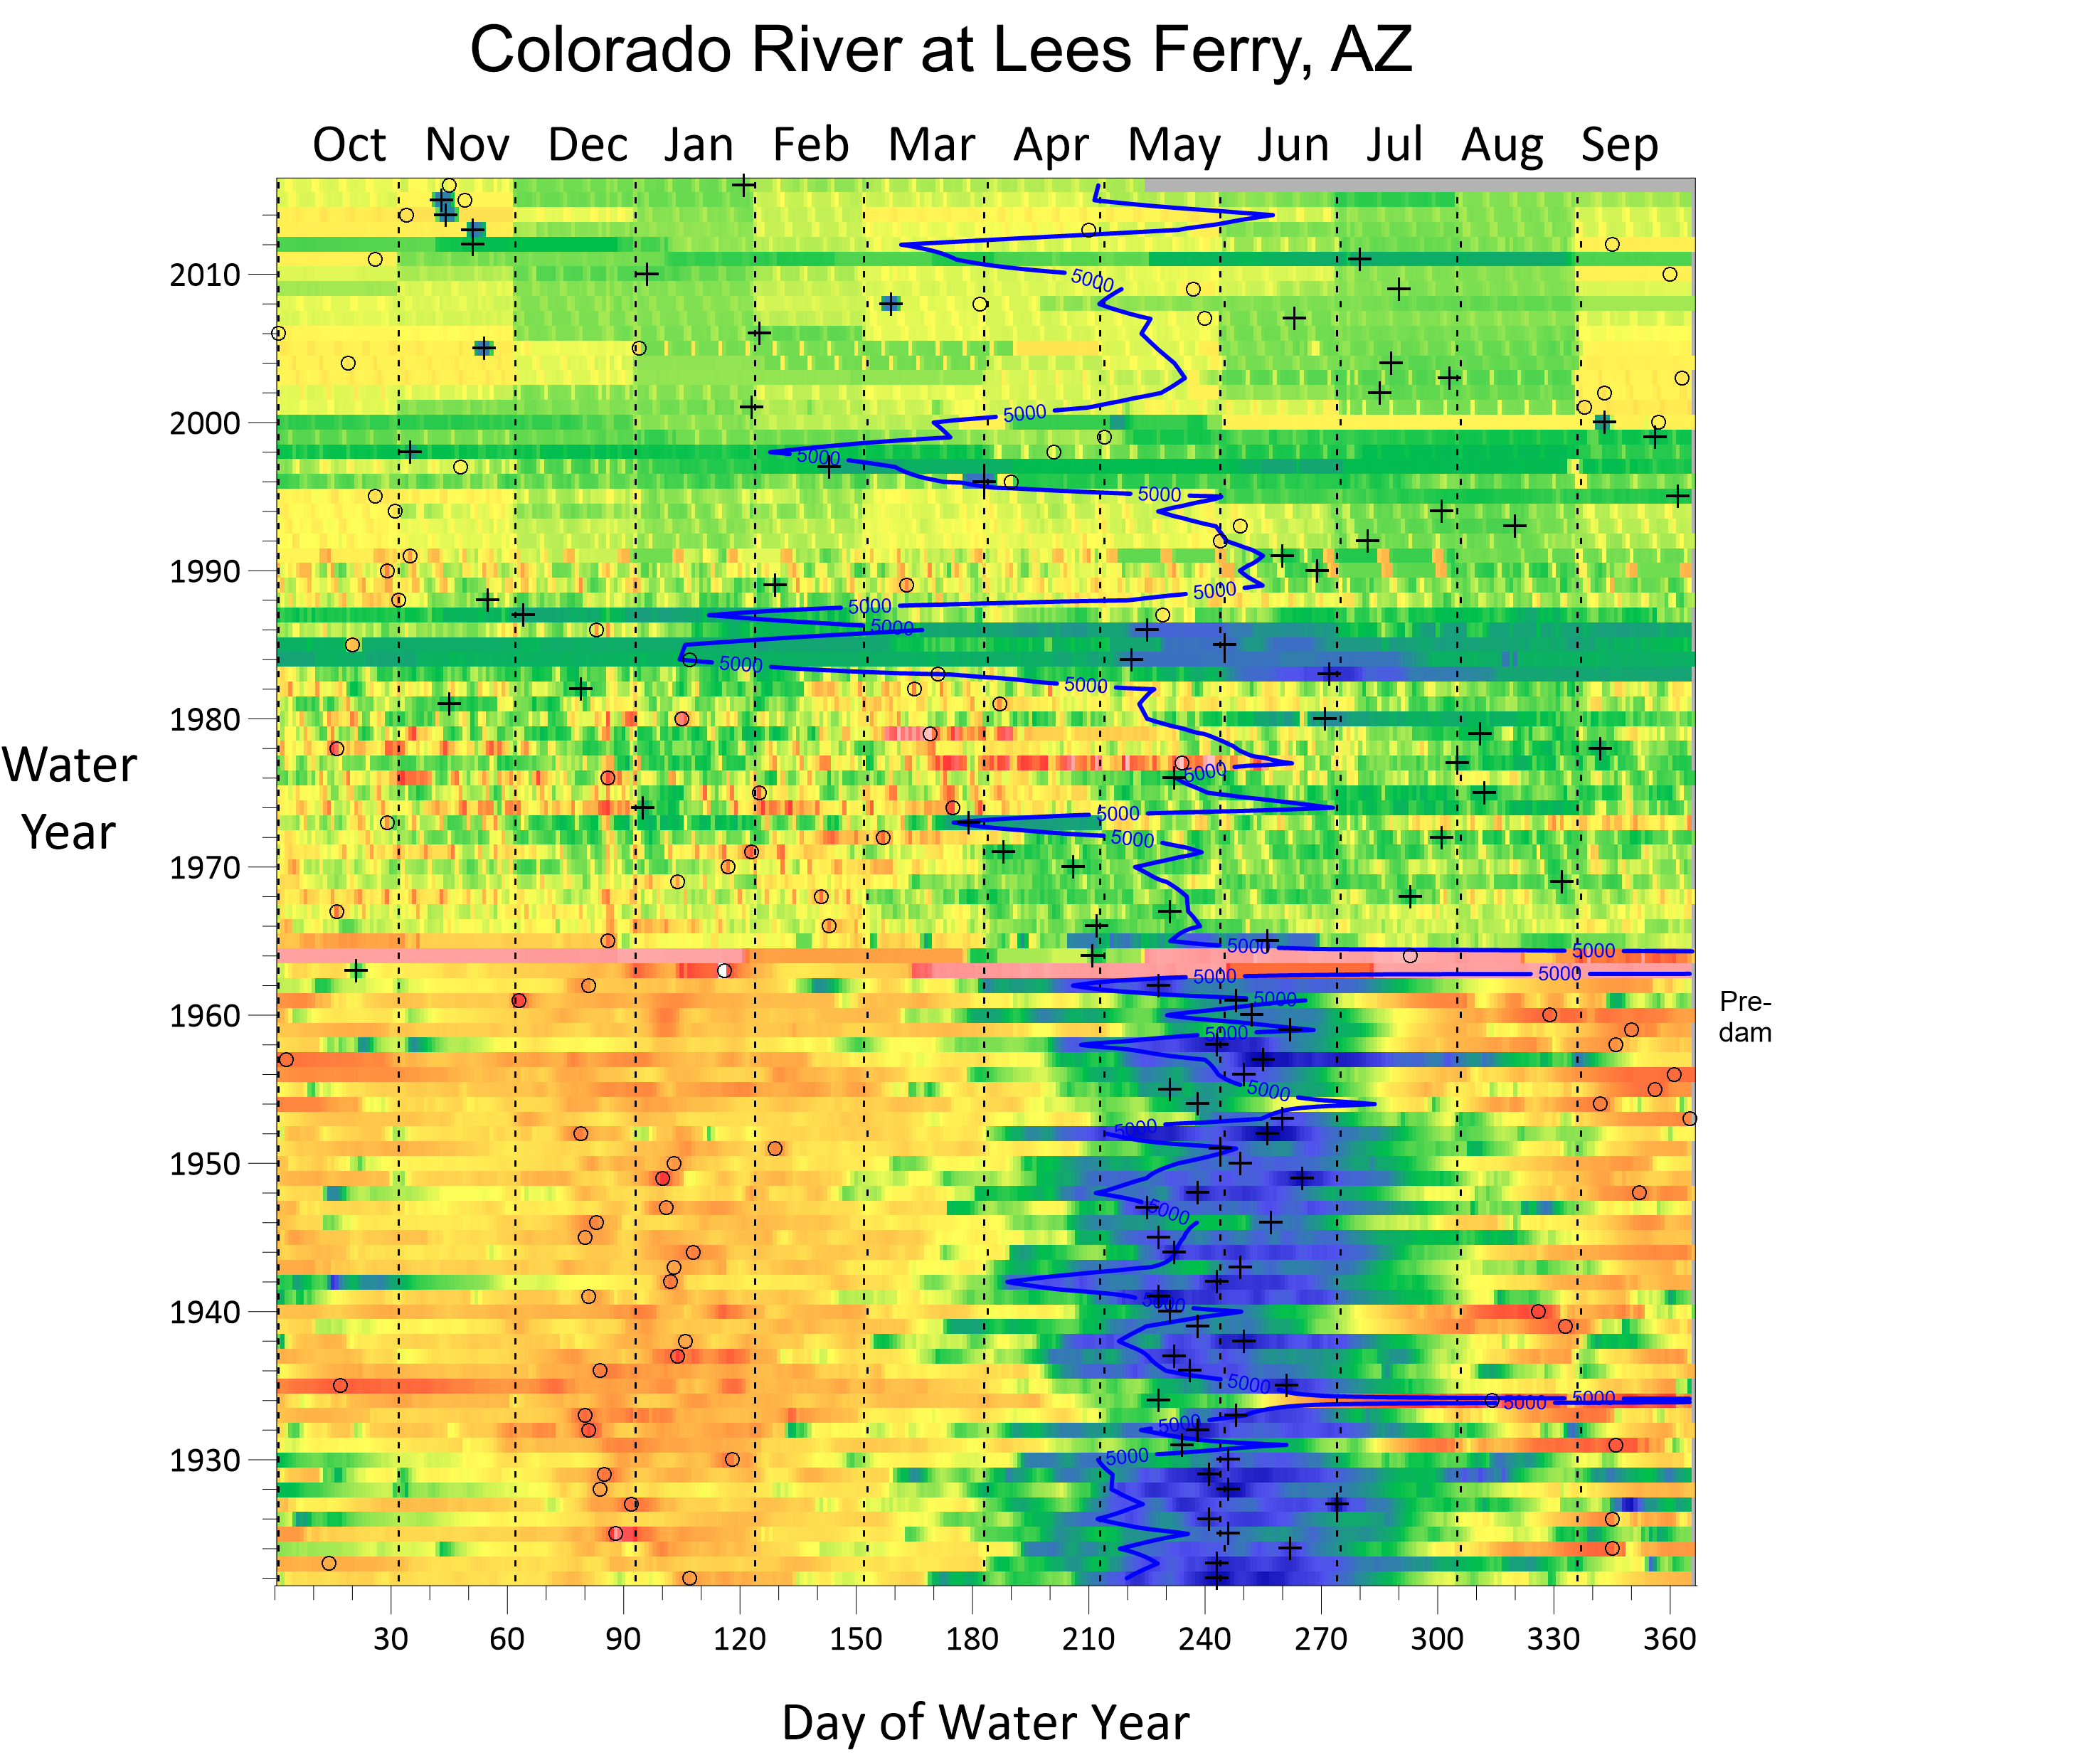
This time-series raster map indicates daily peak volumetric flow rates of the Colorado River at Lees Ferry, AZ over approximately the last 100 years.
Golden, Colorado, 2 April 2019 – Golden Software, a developer of affordable scientific graphics software, will present a free webinar to demonstrate how the Surfer® 2D and 3D mapping package can be used to easily and quickly visualize changes in data points over time for analysis of patterns, trends, and anomalies.
The webinar, entitled “Data Visualization and Analysis of Time Series Using Surfer,” has been developed for scientists, engineers and researchers involved in water resource management, environmental monitoring, urban planning, transportation/traffic engineering, signal processing and other geospatial applications.
“Anyone who maps data as a time series will benefit from this webinar,” said Drew Dudley, Training Coordinator at Golden Software.
Featured in the webinar will be Dr. Richard Koehler, CEO of Visual Data Analytics, who will demonstrate techniques he has developed to display and quantify temporal signatures in Surfer and present them as raster maps. A hydrologist and geodesist by training, Koehler will discuss applications of the technique in several case studies, including water flow analysis on the Colorado River at Lees Ferry, Arizona.
The one-hour webinar will be held live at three times to accommodate Surfer users around the world:
April 16 at 10 am U.S. Mountain Daylight Time (MDT)
April 17 at 6 pm MDT
April 18 at 7 am MDT
Registration is open now at https://attendee.gotowebinar.com/rt/708200232730214413.
“Temporal mapping is a great way to make times series data understandable to technical and non-technical people,” said Koehler. “This type of time series visualization can’t be easily accomplished with most other GIS packages.”
Webinar attendees will learn how to:
- Structure their data for time series visualization,
- Generate raster graphics representing daily, weekly, seasonal and annual patterns,
- Stack multiple temporal raster plots for GIS-like interpretation.
Surfer is a robust 2D and 3D data visualization and mapping software that routinely outperforms more expensive packages. It enables users to model their data sets, apply an array of advanced analytics tools, and graphically communicate the results in ways anyone can understand. Known for its fast and powerful contouring and interpolation algorithms, Surfer is used extensively by geologists in mining and oil & gas activities and by engineers and hydrologists in environmental monitoring projects.
About Golden Software
Founded in 1983, Golden Software is a leading developer of affordable scientific graphics software. Its customer base includes over 100,000 users involved in environmental consulting, oil and gas exploration and extraction, mining exploration and extraction, engineering, applied science, business, education, and government in 186 countries and territories. Golden Software offers six products: Surfer® for gridding, contouring and 3D surface mapping; Voxler® for 3D data visualization; Grapher™ for 2D and 3D graphing; Strater® for well log, borehole and cross section plotting; MapViewer™ for thematic mapping and spatial analysis; and Didger® for digitizing and coordinate conversion. For additional information, visit www.GoldenSoftware.com or call 1-303-279-1021.