 The good folks over at the NGS have been hammering out the size and shape of our rock for decades. In the last year or so, they have been asking the community to define what we want to see next. 2022 is the milestone year for Mother Earth to slip into her new skinny jeans and head out on the town. There’s plenty of information, free webinars, books, and FAQ’s being pumped out by NGS. At this point it looks like we’re being encouraged to adopt low distortion projections within the communities that are willing to embrace the opportunity. What’s the advantage? Basically, the grid is set to fit along the ground in a way that makes the magic happy skybeam box scale the same distance our ropes stretch through the mud. That’s a big jump from the first sea-level grid figured to line up a Model T’s tire ruts as roads crossed state lines. A century later we are all walking around with enough computing power in our cell phones to detonate the earth six times over and watch Netflix. I think it’s pretty clear that we can pull off low distortion projections (LDP) a lot faster than it takes to have a pizza delivered, at least where I live.
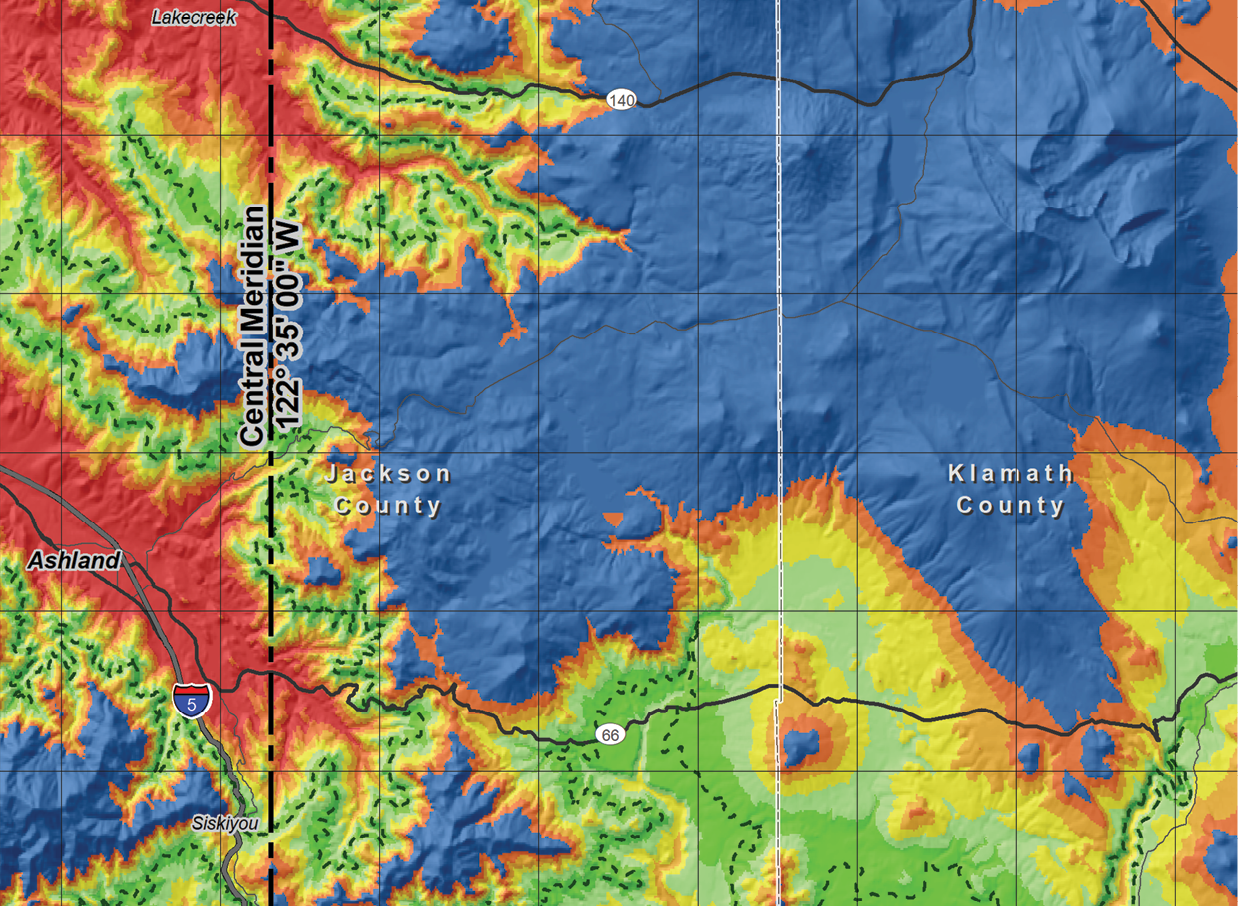
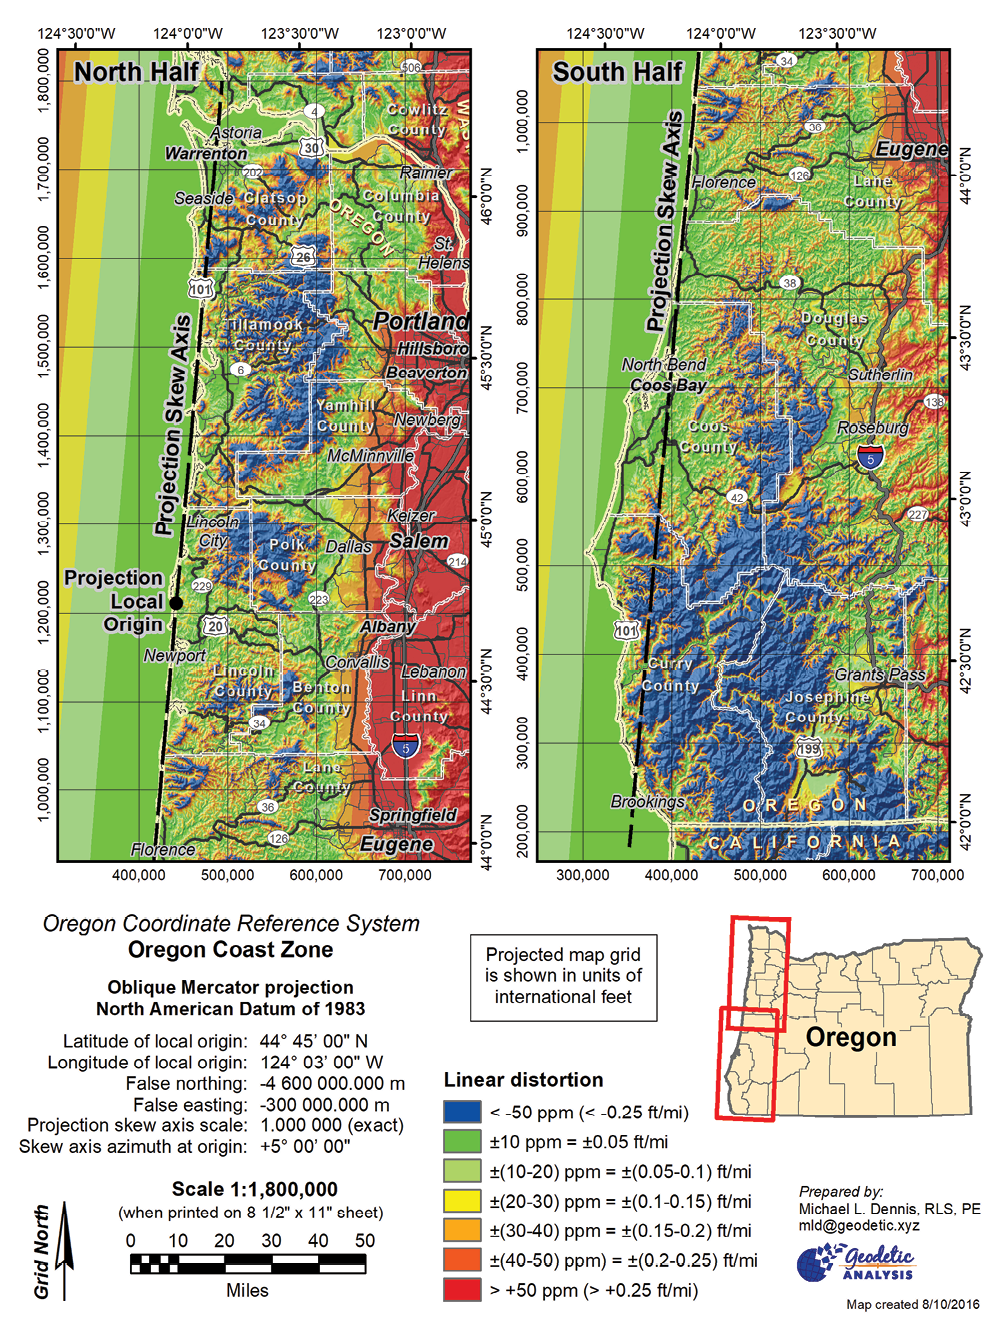 Several states have already adopted LDP’s including Iowa, Oregon, and Wisconsin. These states have published handbooks for their systems under a common format. The handbooks are available for free and online through respective state agencies or DOTs. Oregon bundled up their traditional two zone NAD 1927 and NAD 1983 dual parallel Lambert Projections with a thirty-nine zone system of LDP’s and adopted it in statute as the Oregon Coordinate Reference System. Creating and using LDPs is easy peasy with our modern tools and the published handbooks. Oregon’s handbook lists all of the parameters for every zone and includes a heat map showing the expected distortion within each zone. Every zone includes a “virtual grid coordinate software check” to help ensure that everything is working correctly down to the hundredth of a millimeter. That’s microscopic! It’s also a fantasy in the dirt, but we’re talking about collimating our systems here. This is simple approach toward testing a bunch of different places where wires can get crossed before and after we head out to the hills. Good stuff!
Okay, the two-parallel Lambert Conic Conformal Projection and the Transverse Mercator Projection have been used in the State Plane Coordinate System since its beginning. There are a kazillion elementary survey books that show you how to compute projected coordinates from lat/long on the ellipse and bring ‘em back down. Granted this process can get pretty mathy and is aided with old tables published by NGS. There are no secrets or witchcraft involved, just pencil, paper, and math. If you’re like me that also includes an eraser and a hot piping cup of swear words. If you search the internet deep enough you will find a set of coordinate conversion programs for HP35s calculator. The software “check values” in the Oregon handbook will let you know if your last 2 hours of keystroke programming were successful. There should be no trouble with transverse Mercator or traditional two-parallel (secant) Lambert projections and GSR-80/WGS84 ellipse conversions. You may see some fuzz around the last microscopic decimal place as a result of keying in a certain static value rather than “mathing” it in and letting the calculator sharpen the pencil. Otherwise, and for the other 99.99999% of you that have better things to do than whittling on an RPN program, this should be a straightforward deal in your commercial software.
There are plenty of great resources and hand tools available to compute projections and explore the mapping sciences. As Low Distortion Projections become more prevalent throughout our industry, the demand for greater knowledge drives our professional curiosity.
The two-parallel Lambert projection is apparently still taught for the same reason that we change our clocks twice a year. Somebody a long time ago thought it might a good idea, but nobody has really cared enough to, well, care about it. So up to now, it’s always been “just the way we do it!” This is changing quickly. The hip and lo-down geocentric crowd is asking “why and why not” which is leading to the development of single parallel Lambert Conic Conformal Projections. Those crazy kids are kickin’ it up off the ellipse a notch or two by scaling the central meridian over 1 to match a representative ground height. I call this “bringin’ da’ goods to da’ peeps on da’ streets” or just plain useful. This trend also includes twisting the central meridian of a Mercator projection to match a feature like a river. These Oblique Mercator projections offer a great opportunity to make a small part of the world fit all cozy with an important feature like a coastline or river. Oregon has projected 39 zones using a combination of Lambert singles, oblique Merc’s, and Transverse Mercator definitions. Of course the integrity of the former dual zone Oregon State Plane NAD 27/NAD 83 systems continue to be defined by twin parallel Lamberts and have been preserved in the overlying system.
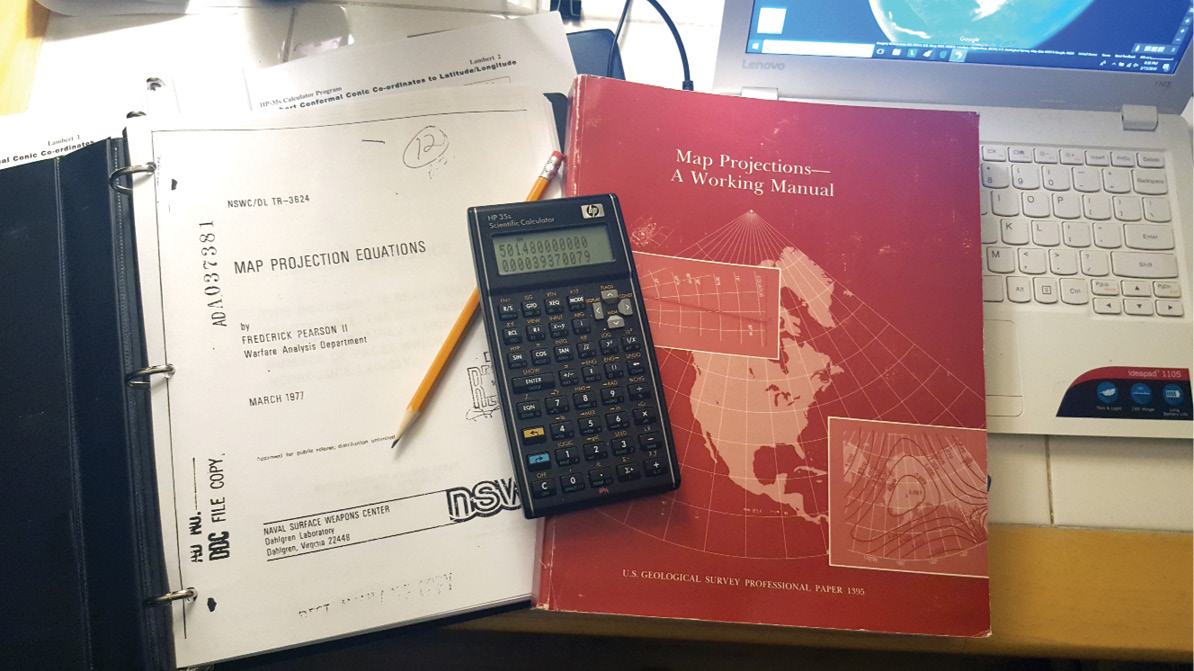
 Despite this being really easy stuff to pull off in your commercial software package, surprisingly it’s not always a textbook norm. Although the methods have been clearly spelled out for a century among higher academia, the profession was slow to put them into practice until the GPS whirlybirds landed at the gates of Microsoft. Most of our normal textbooks stuck close to the traditional dual parallel Lambert and Transverse Mercator projections. I suspect that’s simply all the profession really demanded up to the last decade. For those interested in the nuts and bolts of the alternate projections being adopted there are very good online resources and downloads. Google is quick to start the name dropping with John P. Snyder, Frederick Pearson II, and James E. Stem. They have all published fantastic works and most often an open source pdf version of their government pubs are out there. I found Pearson’s “Map Projection Equations”. It was originally published in 1977 by the Warfare Analysis Department through the Naval Surface Weapons Center. What cold war era bomb shelter would be complete without this jim dandy of a read and 400 cases of TAB soda? Pearson covers about thirty projection types, distortion, transformations, and spheroid/ellipse along with other fundamentals. Pearson is quick to lay down the principles of the single parallel Lambert and show the math. I found this quite helpful where “Elementary Surveying” glosses over singles and jumps straight to dual parallel Lambert. What’s the big deal? Well, single parallel Lambert projections are the heart of east-west LDP’s and are becoming a routine part of our professional practice. Finding good study guides isn’t difficult; they just might not be in our bookshelves or in our “go to” references.
Our profession is evolving with technology and the jump from an imaginary sea-level mapping plane to something that actually fits the ground has been a real thing for at least a decade. Now is the time to get up to snuff with projections that have historically lain dormant in our textbooks. There are no shortage of web resources, publications, and NGS resources.
This is a bit of an HP 35s postscript. Despite all of the fantastic data collectors and software packages available I still find myself wanting to pull out the 35s and do this stuff the hard way, almost. I found some programs online written by Dr. Bill Hazelton. They are classic dual parallel Lambert and Transverse Mercator models and, work great with traditional NAD27/83 zones. Dr. Hazelton put these together just before Michael Dennis caught traction with LDPs. Consequently the programs reflect the last century of the State Plane “knowledge base” very well but simply don’t realize our future with LDPs. No biggie, Dr. H’s gems just need a fresh coat of paint and a few minor tweaks. I think, Dr. H. focused on each program working as “stand alones”, so for starters there’s a good chunk of duplicate subroutine code that could be consolidated. More importantly, adapting the Lambert routines to accommodate single parallel models is really simple after you break the code. Just a few added keystrokes and we make the jump to light speed.
I can’t really imagine a practical scenario where the tiny 32K RAM HP35s is going compete with the 8 Gigs of ram onboard something like a Trimble TSC7. However, the HP35s really becomes essential as an academic and educational tool. The traditional algebraic notation looks foreign because it is written in a language that most of us outside of academia don’t bother to develop a strong vocabulary in. It’s just “the math”. RPN logic on the other hand seems to reflect how we do math, not speak it. RPN requires the user to translate the algebraic notation and break it down step by step. Heck, that’s every math teacher’s unattainable dream in a 50/50/50 classroom (50 minutes/50 students/50 second attention span). So we have a great tool that will not only produce results, but will help us translate and understand the logic behind the math.
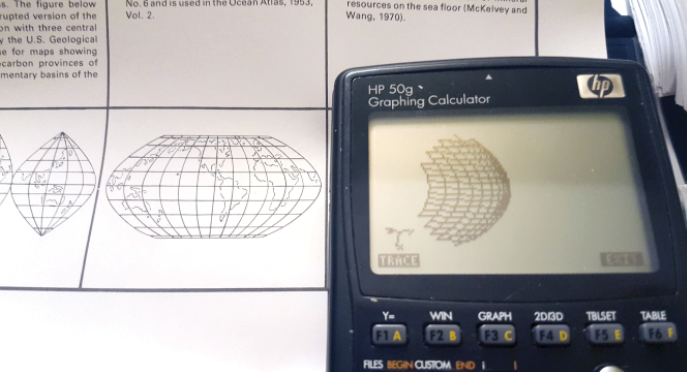
As more folks approach designing LDPs, calculators can be quite the handy tool to whip out at the planning table and the head scratching phases of the project. There’s not necessarily a lot of head scratching involved with designing simple LDPs but it’s nice to have a “magic slate” lying around when curiosities arise. Higher end graphing calculators offer an overabundance of computing power. If you gave a 1977 college student a 2019 HP Prime or TI Inspire they might describe it as an electronic math book that does the problems for you. With modern “text book entry” a clown like me can simply parrot Frederick Pearson’s formulae into the box and watch it all work. Even better, simpletons like me can embed sub equations into larger equations and build super equations that cut right to the chase. So, four decades later the technology and public awareness have caught up to Pearson’s work. Now the stage is set for the workin’ folk to usher in some really cozy map projections with a few simple household items. I mean really, who doesn’t have access to a TI or HP graphing calculator in 2019?